Employer Activity
In 2025, over 44,000 job vacancies were posted on headhunter.kg, which is an increase of 3.6% compared to 2024. This activity across various sectors and regions indicates a stable demand for specialists.However, a decrease in employer activity was observed in some cities: in Jalal-Abad (-7.2%), Kant (-7.0%), Kara-Balta (-7.3%), and Naryn (-3.9%). This may indicate local changes in demand. Overall, Bishkek remains the main hub in the labor market, although positive trends are also noted in certain regions.
Areas with the highest number of vacancies in 2025:
- Among professional fields with limited growth are: administrative staff (5.0%, +1.9%), construction and real estate (4.8%, +1.6%), tourism, hotels, and restaurants (4.3%, +0.4%), and healthcare (3.4%, +4.9%).
- At the same time, there is a decrease in interest in finance and accounting (6.7%, -0.5%), domestic and service staff (4.5%, -0.4%), manual labor (4.2%, -10.6%), as well as in transportation and logistics (3.7%, -2.1%).
- The highest growth is observed in science and education (2.3%, +27.9%), management (1.2%, +19.4%), law (1.2%, +21.3%), arts and mass media (1.2%, +13.8%), and especially in insurance (0.2%, +62.1%).
- At the same time, significant decreases in demand are noted in some niche areas: raw material extraction (0.8%, -16.5%), agriculture (0.7%, -22.3%), security (0.4%, -12.7%), and consulting (0.9%, -5.0%).
Salaries
The median salary in Kyrgyzstan in 2025 amounted to 45,907 soms, an increase of 6% compared to 2024. Analysts believe that the median salary is a more objective indicator than the average, as it excludes the influence of extreme values (very high or low salaries) and reflects the central tendency.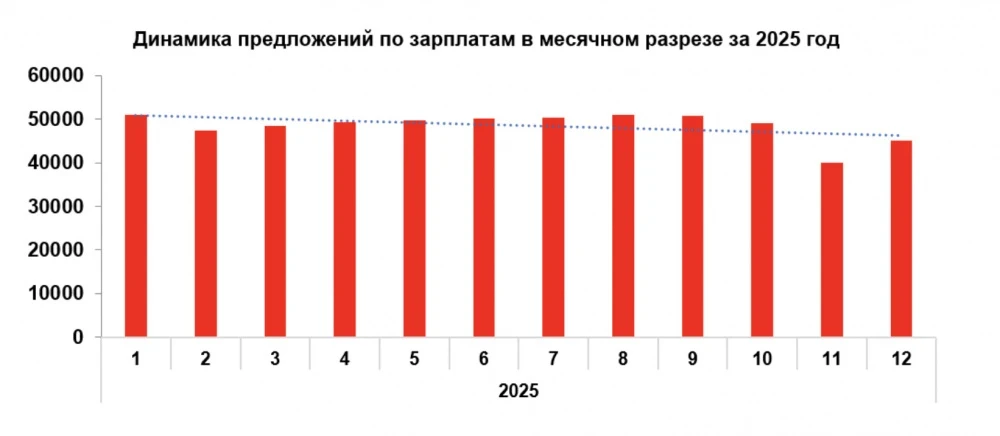
Source: bishkek.headhunter.kg.
In 2025, median salaries in the largest cities of Kyrgyzstan demonstrated significant diversity and variability compared to 2024. Salary levels range from 39.7 thousand soms to 46.2 thousand soms, reflecting differences in economic activity and demand structure in the labor market across regions.
- Bishkek continues to lead in salary levels with a median figure of 46.2 thousand soms, although this represents a decrease of 12.3% compared to the previous year. Despite this, the capital maintains its status as the main labor market with high salary offers.
- Tokmok ranks second with a median salary of 46.0 thousand soms, an increase of 9.7% year-on-year, indicating growth in local demand and competition.
- Jalal-Abad and Karakol entered the group of cities with average salaries, where the median salary was 43.0 thousand soms (+10.3% in Jalal-Abad and +7.5% in Karakol), indicating a gradual strengthening of regional labor markets.
- In contrast, Osh showed the largest decline, with the median salary dropping to 39.7 thousand soms, a decrease of -20.1%, which may indicate a correction in salary expectations and a change in demand structure.
| Top and middle management | 68,642 | 9.30% |
| Agriculture | 63,218 | -21.90% |
| Automotive business | 61,543 | 14.20% |
| Raw material extraction | 59,129 | -22.80% |
| Marketing, advertising, PR | 54,166 | 16.60% |
| Construction, real estate | 54,047 | -10.10% |
| Sports clubs, fitness centers, beauty salons | 53,749 | 15.30% |
| Procurement | 53,572 | -0.60% |
| Human resources, training | 49,606 | 9.30% |
| Transportation, logistics, shipping | 48,064 | -2.50% |
| Sales, customer service | 48,039 | 8.70% |
| Manual labor | 47,734 | -8.30% |
| Manufacturing, servicing | 47,423 | -6.20% |
| Arts, entertainment, mass media | 42,432 | 6.10% |
| Finance, accounting | 42,370 | -2.50% |
| Retail | 42,112 | 10.20% |
| Lawyers | 42,072 | 13.80% |
| Insurance | 40,000 | 45.50% |
| Domestic and service staff | 39,778 | 4.60% |
| Science, education | 39,643 | 13.30% |
| Tourism, hotels, restaurants | 38,728 | 4.10% |
| Information technology | 36,345 | -3.70% |
| Administrative staff | 36,208 | 3.50% |
| Medicine, pharmaceuticals | 35,295 | 0.80% |
| Strategy, investments, consulting | 20,624 | -54.30% |
| Security | 20,036 | -11.00% |
Applicant Activity
The number of active resumes on headhunter.kg in 2025 exceeded 217,000, an increase of 20.8% compared to the previous year. The expected median salary was 49,919 soms. The highest applicant activity was observed in the autumn-winter period.The structure of applicant activity by regions remained unchanged; however, in most major cities, there was an increase in the number of active resumes compared to the previous year. The overall trend indicates an increase in interest in work across most cities in Kyrgyzstan, with Bishkek maintaining its dominant position.
- Bishkek still holds the first place in the number of active resumes, with 194.4 thousand, which is 21.2% more than the previous year, signaling a growing interest in the country's main labor market.
- In Osh, the number of active resumes reached 9.0 thousand (an increase of 15.8%), in Jalal-Abad - 2.4 thousand (+18.3%), and in Karakol - 2.0 thousand (+18.6%), confirming the activation of labor markets in the regions.
- The most significant increase is observed in cities with a smaller initial base: in Sokuluk, the number of resumes nearly doubled - from 325 to 642 (+97.5%), and in Belovodsk - from 261 to 492 (+88.5%). This indicates a significant increase in applicant activity in local labor markets. In some cities, the dynamics were more moderate.
- In Kant, the growth was 12.1%, in Kara-Balta - 10.4%, and in Tokmok - 6.6%. The smallest changes occurred in Talas (+3.2%) and Naryn (+3.9%), indicating stable, albeit moderate, applicant activity.
The most active sectors by the number of resumes:
| Sales, customer service | 14.4% | 8.2% |
| Domestic and service staff | 9.3% | 22.1% |
| Marketing, advertising, PR | 8.7% | 12.4% |
| Manual labor | 8.2% | 35.6% |
| Transportation, logistics, shipping | 7.9% | 33.2% |
| Sports clubs, fitness centers, beauty salons | 7.8% | 9.7% |
| Automotive business | 6.3% | 18.4% |
| Tourism, hotels, restaurants | 5.5% | 12.4% |
| Administrative staff | 5.0% | -5.5% |
| Information technology | 4.5% | -4.4% |
| Construction, real estate | 4.3% | 17.3% |
| Finance, accounting | 3.3% | 15.6% |
| Medicine, pharmaceuticals | 2.9% | -3.2% |
| Retail | 2.3% | -15.7% |
| Science, education | 1.6% | 13.1% |
| Arts, entertainment, mass media | 1.6% | -1.4% |
| Manufacturing, servicing | 1.5% | -8.9% |
| Strategy, investments, consulting | 0.9% | -9.7% |
| Security | 0.8% | 42.7% |
| Lawyers | 0.7% | 11.5% |
| Top and middle management | 0.7% | 0.4% |
| Human resources, training | 0.6% | -14.4% |
| Raw material extraction | 0.5% | -6.2% |
| Agriculture | 0.4% | -25.8% |
| Procurement | 0.3% | -15.3% |
| Insurance | 0.1% | 36.3% |
Competition in the Labor Market
The competition index, reflecting the ratio of resumes to the number of vacancies, was 4.8. This indicates a moderate level of competition for jobs and a healthy ratio between employers and applicants. On average, there are five resumes/applicants for one vacancy. Over the year, competition increased by 16.6%. In several professional fields, competition remained stable. High levels were noted in the fields of security, domestic service, arts, and mass media.| Security | 11.5 | 1.50% |
| Domestic service staff | 6.5 | 2.40% |
| Transportation, logistics, shipping | 5.3 | 3.00% |
| Arts, entertainment, mass media | 5.4 | 0.10% |
| Manual labor | 5.4 | 0.00% |
| Science, education | 4.9 | 1.10% |
| Finance, accounting | 4.8 | 5.30% |
| Strategy, investments, consulting | 4.7 | 0.00% |
| Tourism, hotels, restaurants | 4.7 | 3.10% |
| Administrative staff | 4.6 | -0.10% |
| Medicine, pharmaceuticals | 4 | -0.10% |
| Sports clubs, fitness, beauty salons | 4 | 0.10% |
| Construction, real estate | 3.8 | 0.00% |
| Sales, customer service | 3.8 | 0.00% |
| Automotive business | 3.7 | 0.20% |
| Information technology | 3.5 | 0.00% |
| Marketing, advertising, PR | 3.3 | 0.10% |
| Top and middle management | 3.2 | -0.10% |
| Raw material extraction | 3 | -0.20% |
| Lawyers | 2.8 | 0.00% |
| Agriculture | 2.5 | 0.30% |
| Retail | 2.5 | -0.30% |
| Manufacturing, servicing | 2.3 | 0.20% |
| Human resources, training | 2.2 | 0.00% |
| Procurement | 2.1 | 0.00% |
| Insurance | 1.6 | 2.40% |
Index Values:
- ≤ 1.9 - acute shortage of applicants;
- 2.0–3.9 - shortage of applicants;
- 4.0–7.9 - moderate level of competition for jobs, healthy ratio between employers and applicants;
- 8.0–11.9 - high level of competition among applicants for jobs;
- ≥ 12 - extremely high level of competition among applicants for jobs.